Continued from page 1
Benchmarking
At Architosh, we select a diverse range of benchmarks, including some that are cross-platform. We are especially interested in having readers understand the trade-offs and benefits of discrete GPUs versus GPUs included on a System on a Chip (SoC) design, and between the Windows and the Mac world of computers. That being said, many of the best benchmarks for showing off the strength of a GPU don’t work across platforms, and we focus on those as well.
Our benchmark suite for Architosh continues to evolve and, for this review, includes some updates. Here are the benchmarks:
- Geekbench 6 GPU — Comprehensive general GPU benchmark
- BlenderMark — Very good for ray-tracing testing
- CompuBench — Catmull-Clark and SSS testing
- VRMark (Orange Room) — for testing VR headset capabilities
- SPECviewperf — for shaded CAD/BIM/Rendering testing
Sadly, the highly regarded Maxon Cinebench does not support the Intel Arc PRO B50. However, the VRMark and Enscape tests inside of SPECviewperf V15 can serve to illustrate rendering capabilities.
For this review, we have migrated from SPECviewperf 2020.v3 to SPECviewperf v.15 for testing. The new v.15 results include new tests, such as the Enscape benchmark. Enscape is a highly popular rendering tool in architecture workflows.
Benchmarks
Geekbench 6 GPU
Geekbench 6 is one of the world’s most touted and trusted benchmark applications for CPUs, SoCs, and now GPUs. As a GPU-focused benchmark, Geekbench 6 focuses on GPU compute performance using workloads more applicable to generalized computing rather than CAD, BIM, and 3D applications. These are still meaningful because the average architect, for example, has meaningful workloads that span the gamut from blur effects in Zoom and Teams calls, working with image editors and Adobe products, and ML (machine learning) and AI workloads, which Geekbench 6 GPU specifically tests.
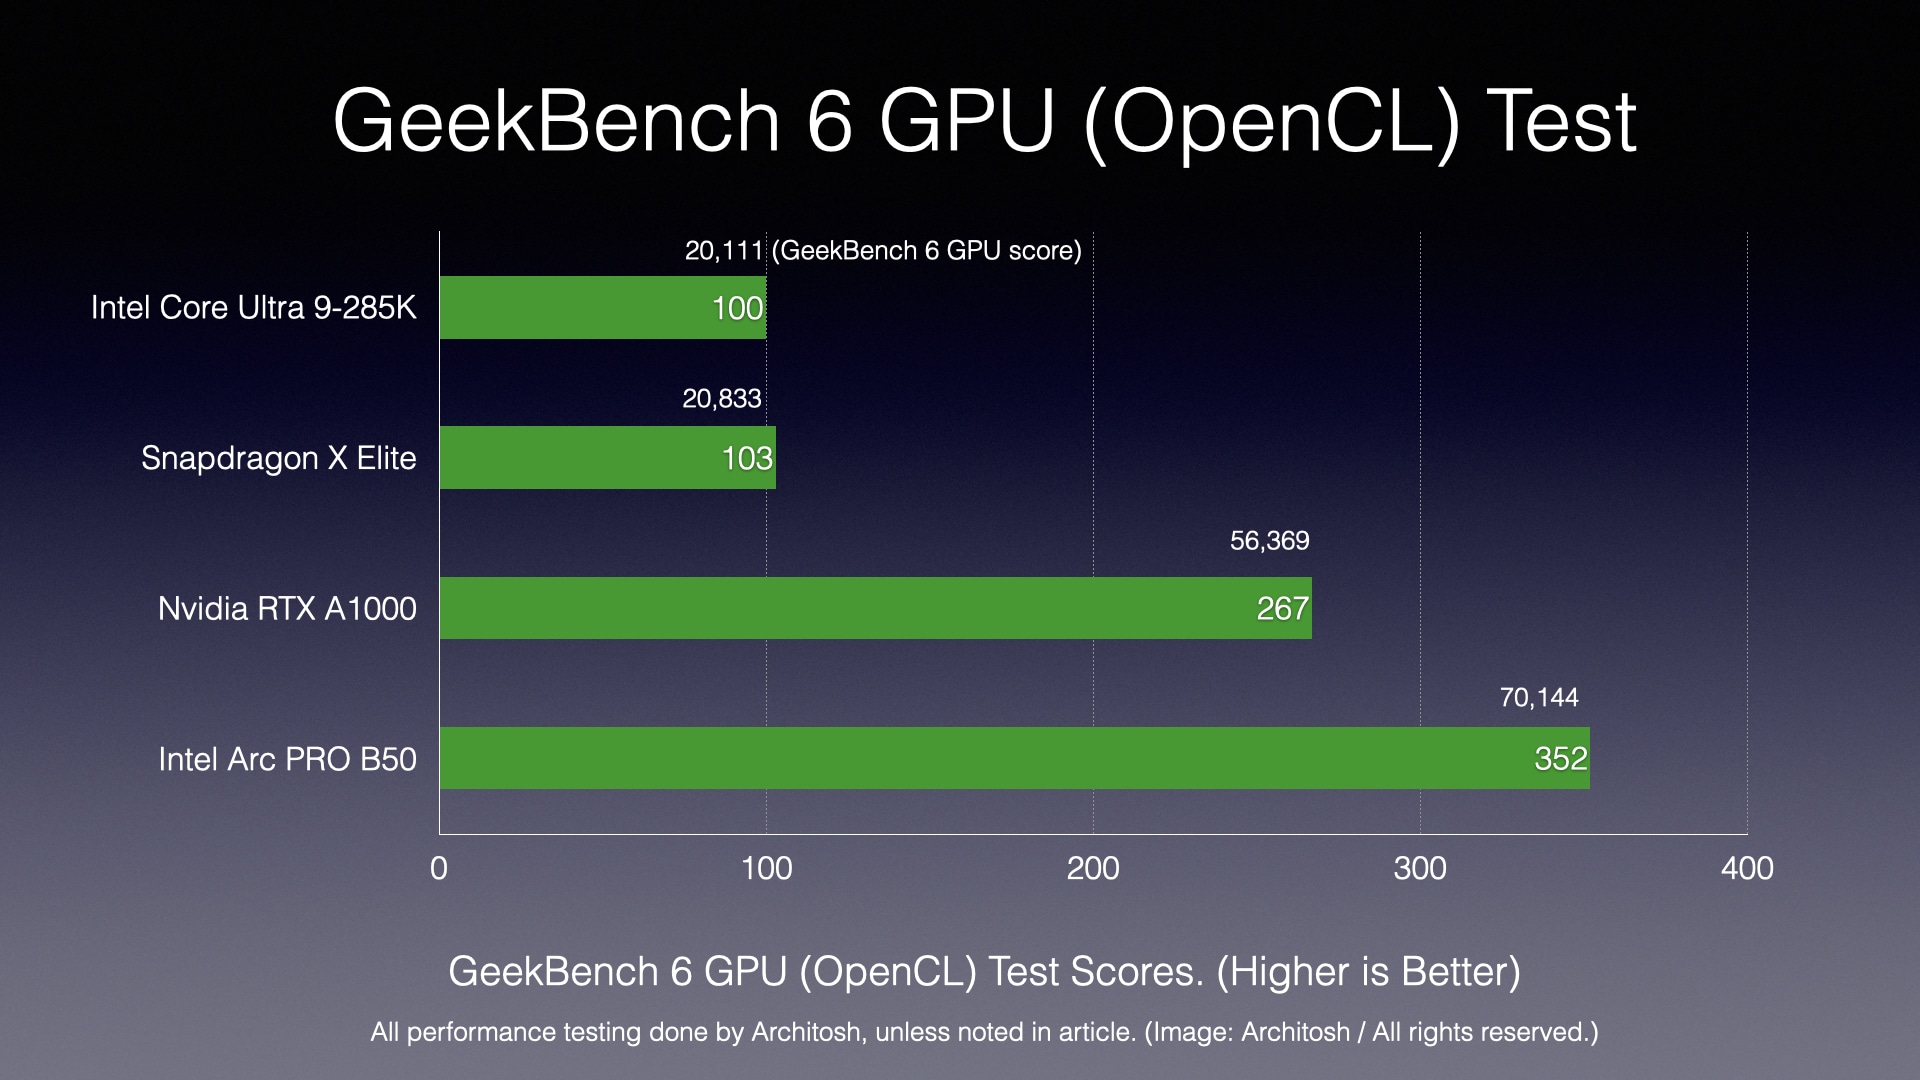
Chart 1: The Geekbench 6 GPU OpenCL benchmark. On this test, the Intel Arc PRO B50 outperformed the Nvidia RTX A1000 GPU by 31%. (Image: Architosh / All rights reserved).
In Geekbench 6 GPU, the subtests remain consistent, but the APIs utilized by the tests are different. The more important API is Vulkan, as it is newer and a lower-level API designed to replace OpenGL. In contrast, OpenCL is a more mature, higher-level API for general-purpose parallel computing workloads across both CPUs and GPUs. Regardless, what we see is that the Intel GPU is considerably faster than its Nvidia reference GPU.
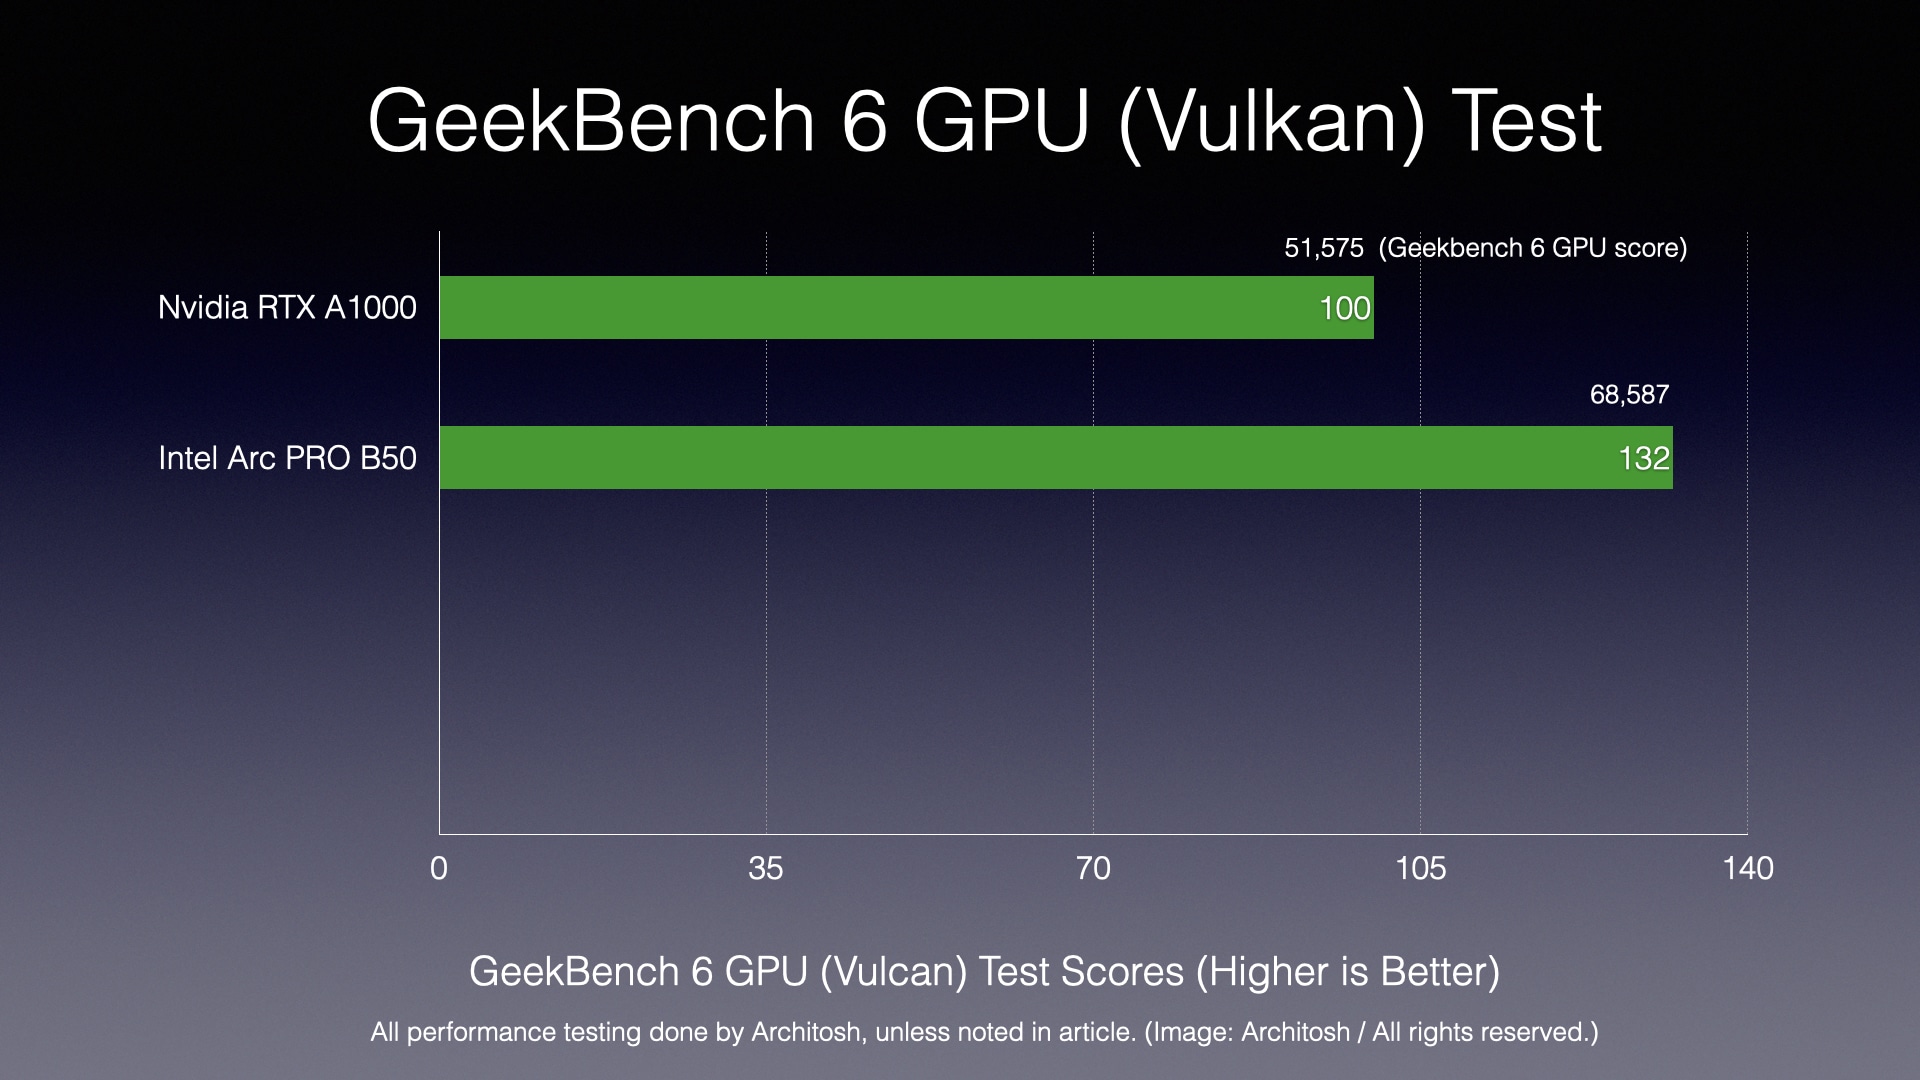
Chart 2: Geekbench 6 GPU Vulkan test. On the Vulkan test, the B50 was 32% faster than the reference RTX A1000. (Image: Architosh / All rights reserved).
For the OpenCL API, the Intel Arc PRO B50 is 31% faster, while for Vulkan, the B50 is 32% faster. This delta applies to more generalized GPU workloads involving machine learning (AI), image synthesis and simulation functions, as noted above.
Blendermark GPU
Now, diving into a professional 3D software program like Blender, the Blendermark performance advantage of the Intel B50 over the RTX A1000 reference GPU comes in at just 26%, which we think somewhat belies the Intel GPU’s rendering performance advantages as seen in other rendering benchmarks. (see below).
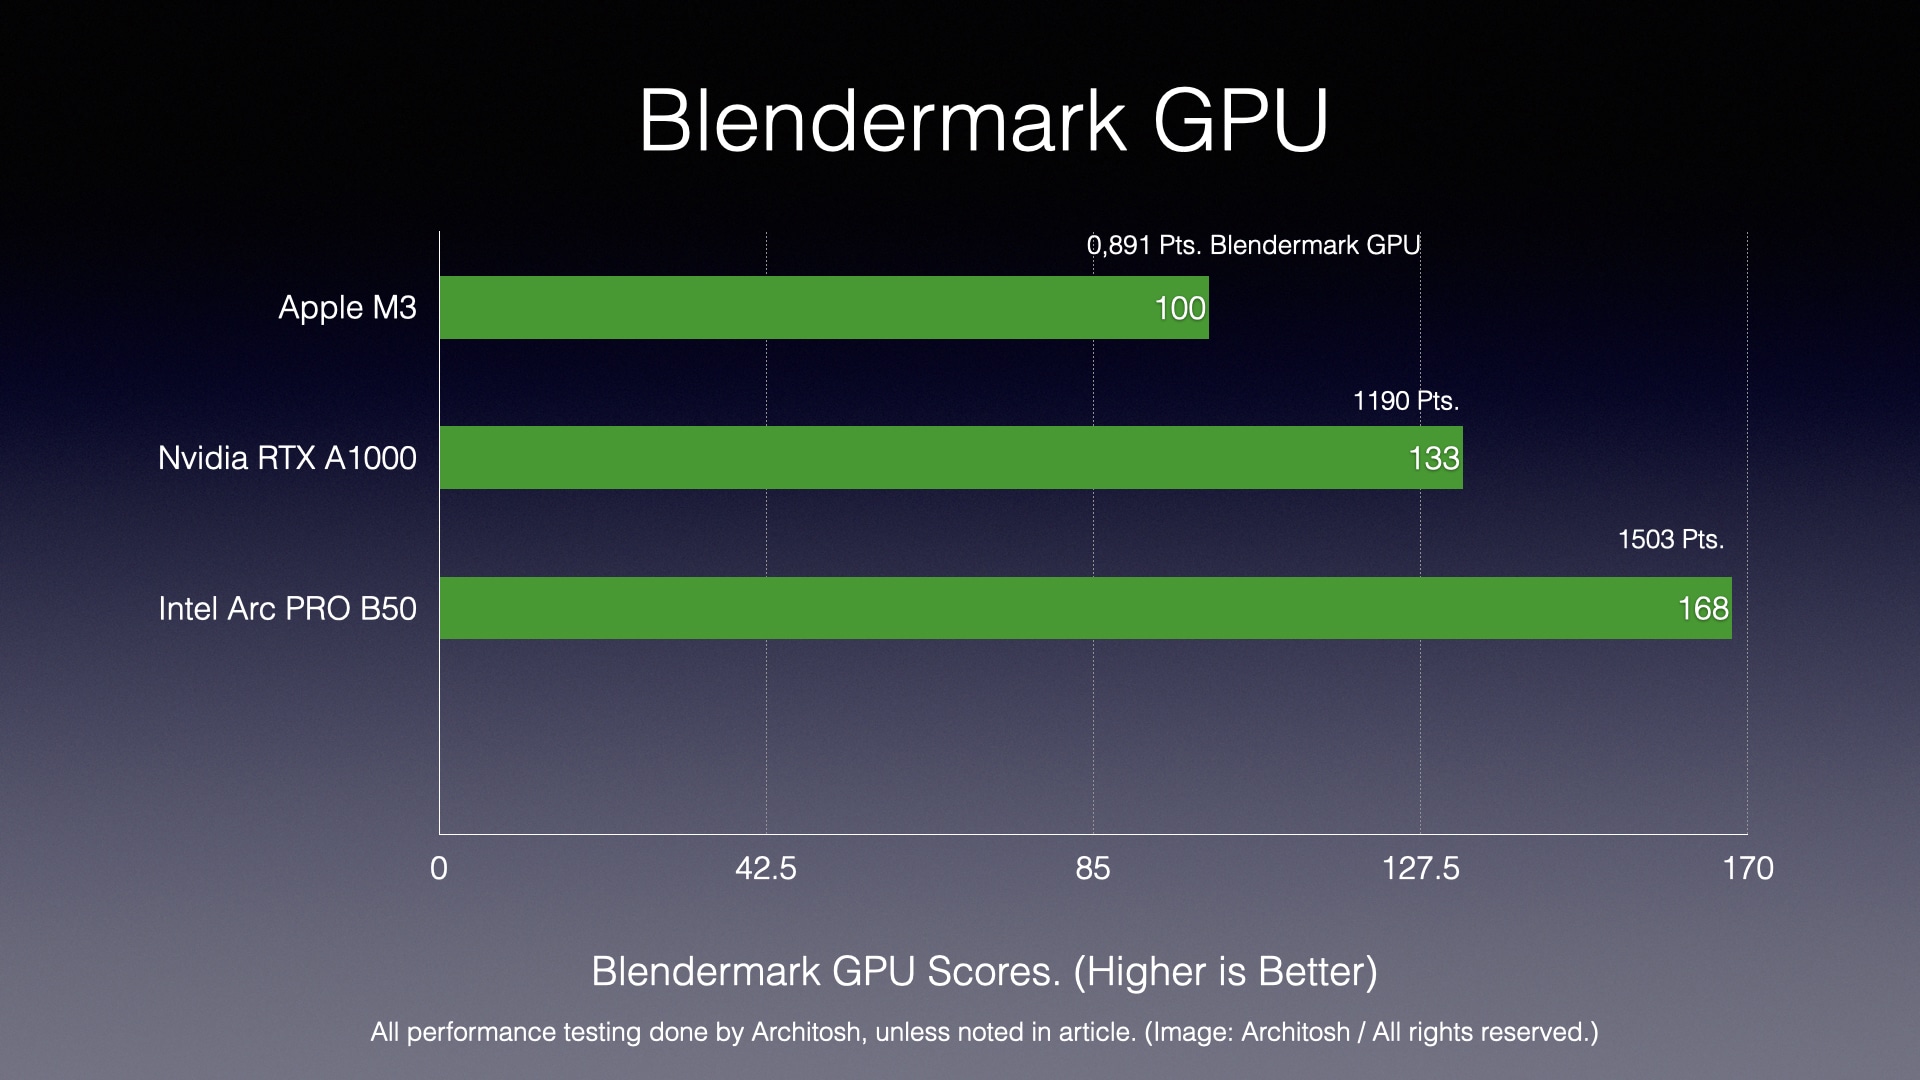
Chart 3: Blendermark GPU test. (Image: Architosh / All rights reserved).
While the Blendermark benchmark gives you a specific set of tests that applies to that application, the next series of tests gets more specific to a wider range of tools.
CompuBench
CompuBench helps us see specialized GPU compute performance, particularly for professional and digital content creation (DCC) workflows.
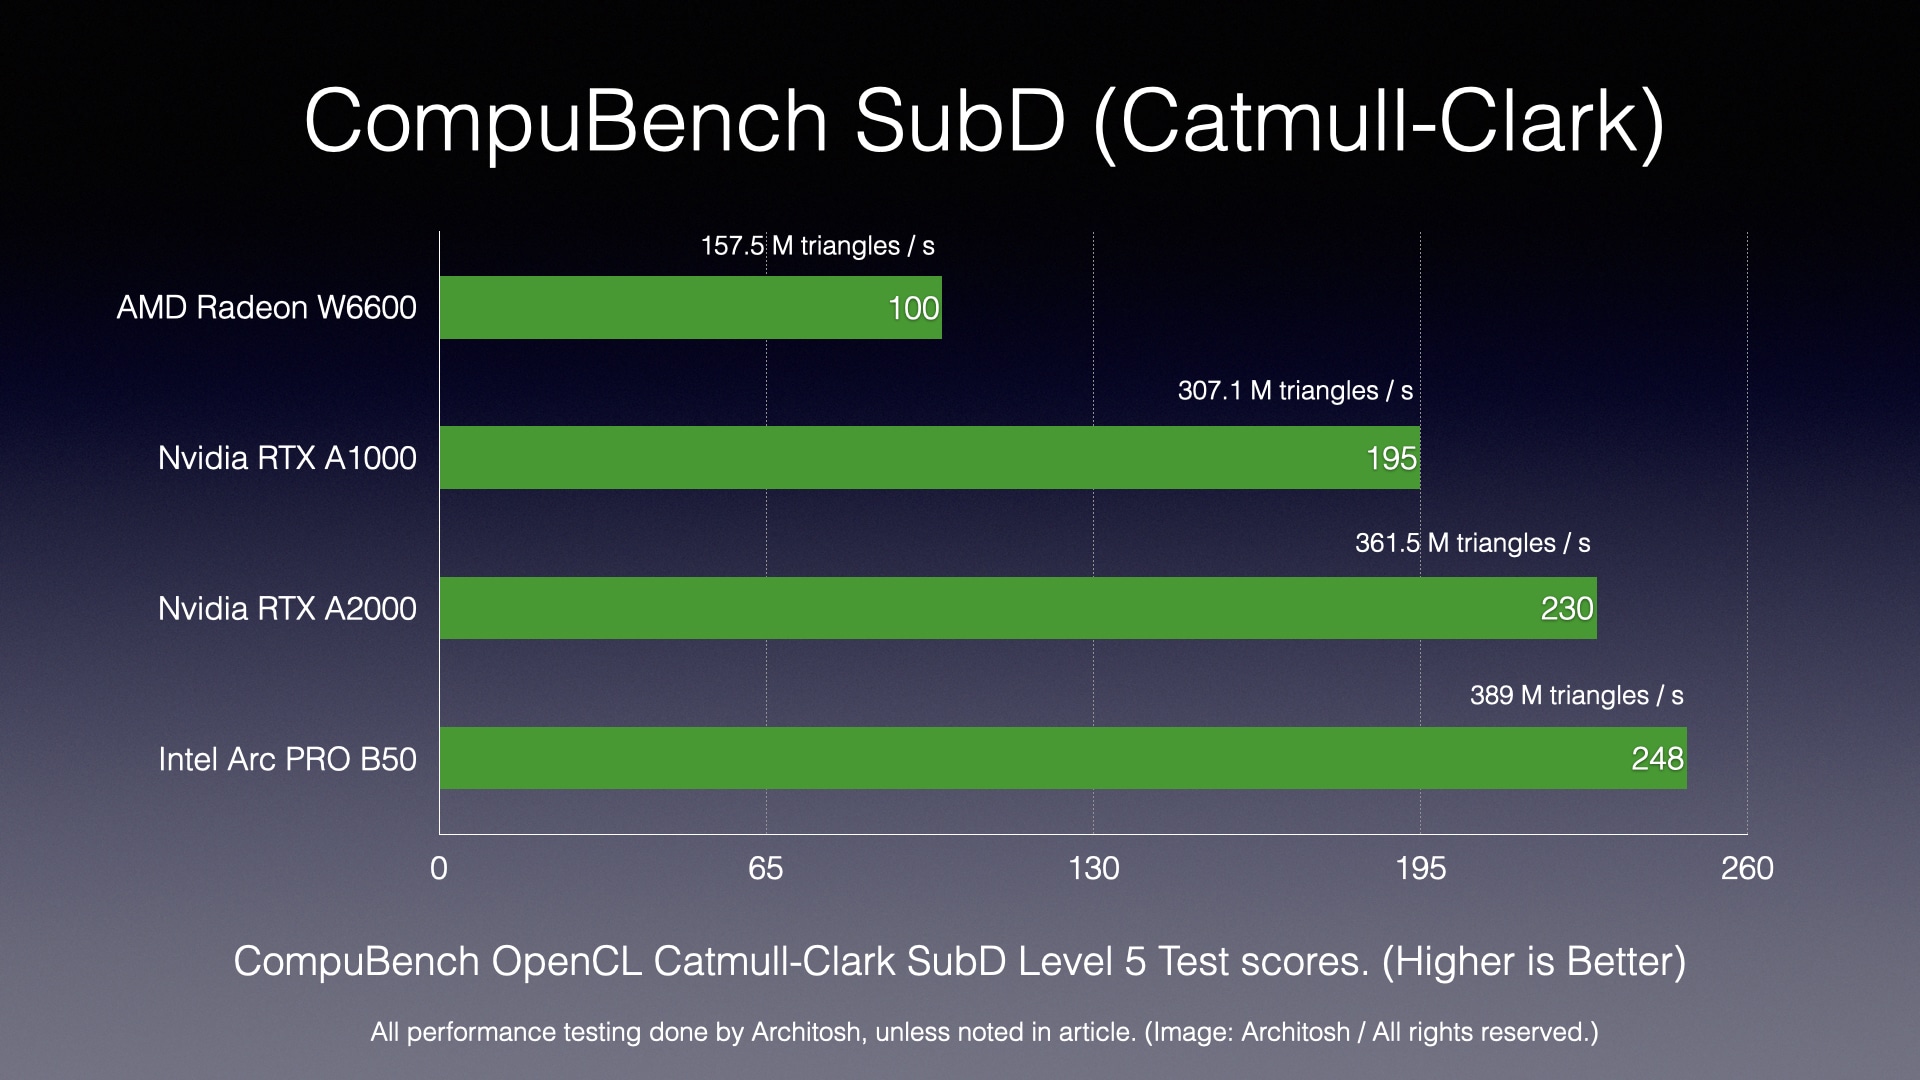
Chart 4: CompuBench (Catmull-Clark) test. (Image: Architosh / All rights reserved).
The Catmull-Clark tests in CompuBench evaluate the GPU’s ability to handle surface subdivision, which creates smooth, curved surfaces from a coarse polygon mesh. The algorithm is found in tools like Maya, Blender, and Pixar’s OpenSubdiv libraries. The Intel B50 scored not only much better than the Nvidia RTX A1000 but also the A2000 GPU. On the Subsurface scattering test, it performed 83% faster, while on the Catmull-Clark test, it performed 27% faster.
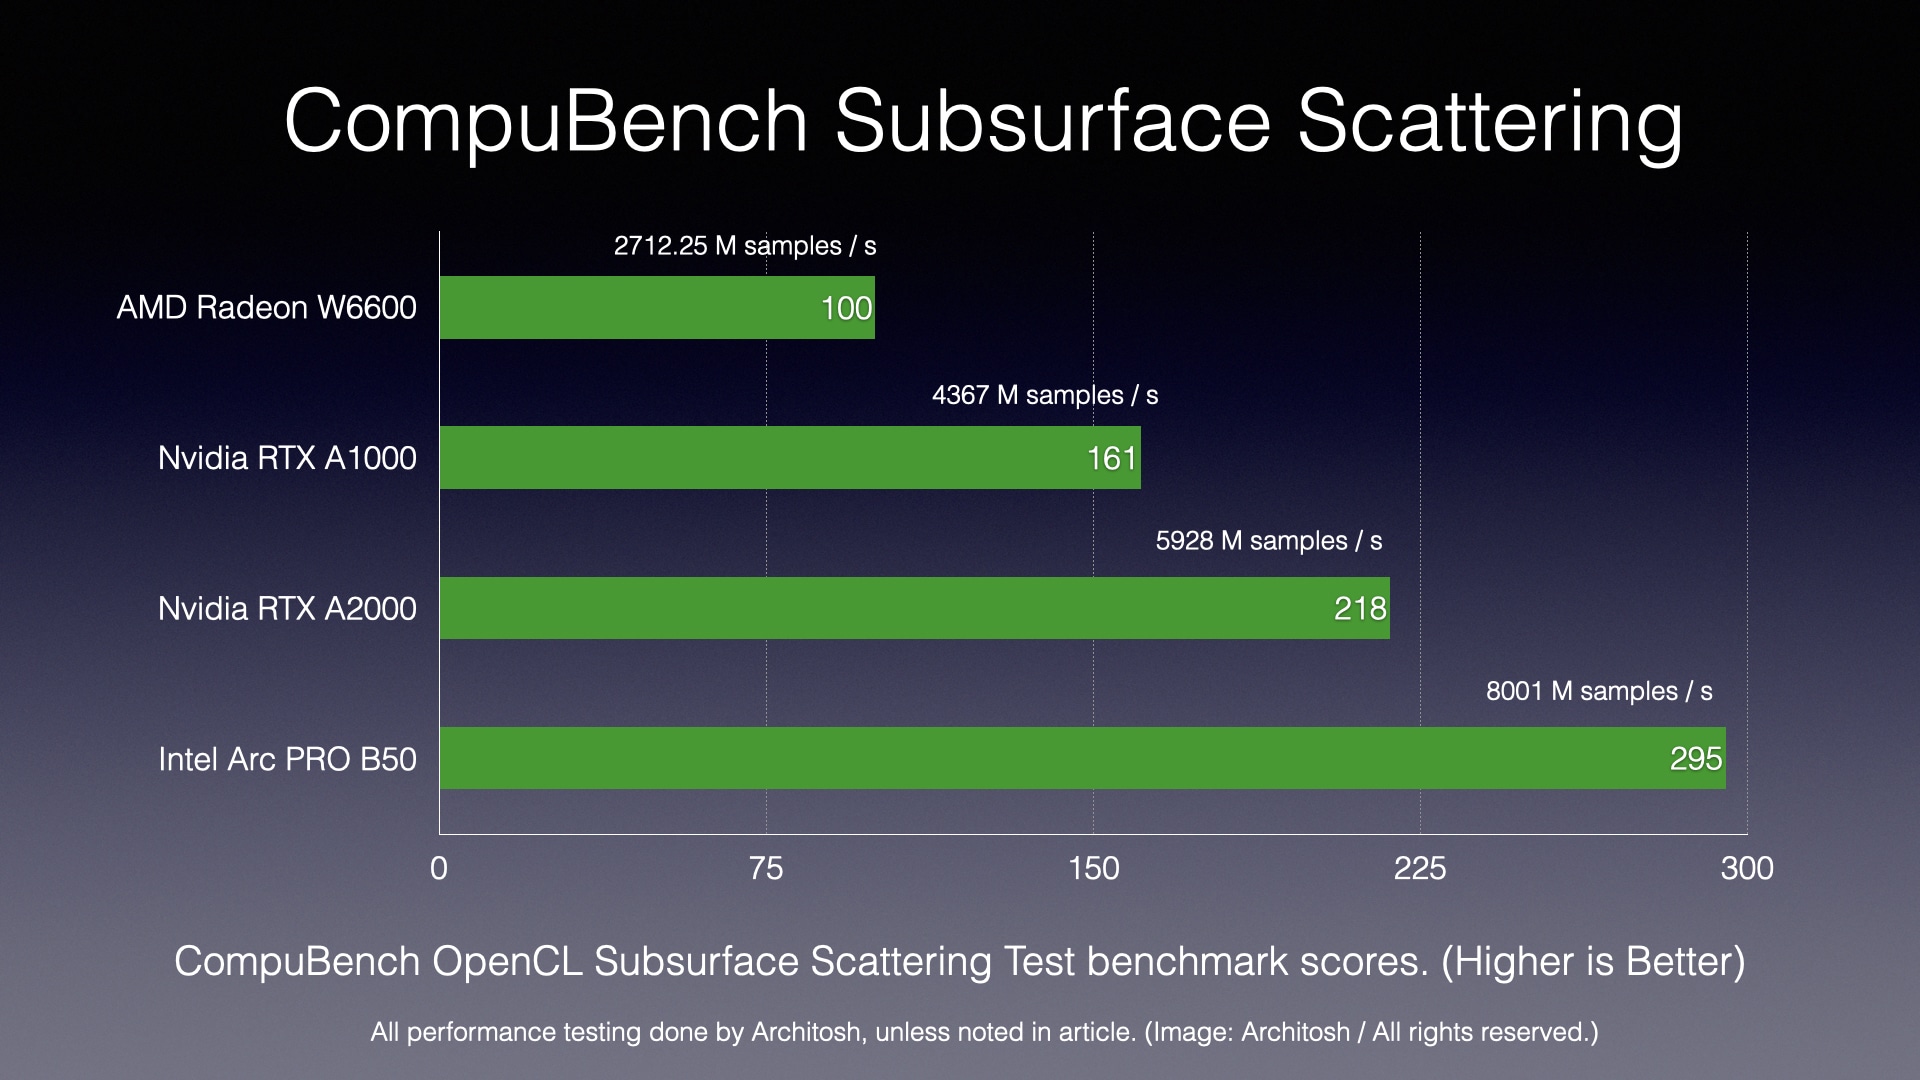
Chart 5: CompuBench Subsurface Scattering test. (Image: Architosh / All rights reserved).
Subsurface Scattering (SSS) simulates how light penetrates a translucent object, scatters beneath the surface, and then exits at a different point. This effect is critical for rendering realistic materials like human skin, marble, and wax. All of this is applicable to rendering workflows across a range of applications. However, CompuBench has a limitation in that it primarily relies on OpenCL for these tests, whereas newer APIs like Vulkan and CUDA are often used in the latest versions of DCC software tools.
Regardless, CompuBench is meaningful for evaluating cross-platform comparisons of a GPU’s parallel compute performance using an open standard (OpenCL) to test common and meaningful algorithms used in DCC and CAD tools. This way, GPUs from Intel and AMD can be compared to Nvidia, which prioritizes CUDA as an API for its own graphics chips.
VRMark (Orange Room) Test
VRMark is a virtual reality benchmark that allows one to test a GPU’s likely performance in driving VR workflows. The benchmark has many different tests within its suite, but we stick with the Orange Room test.
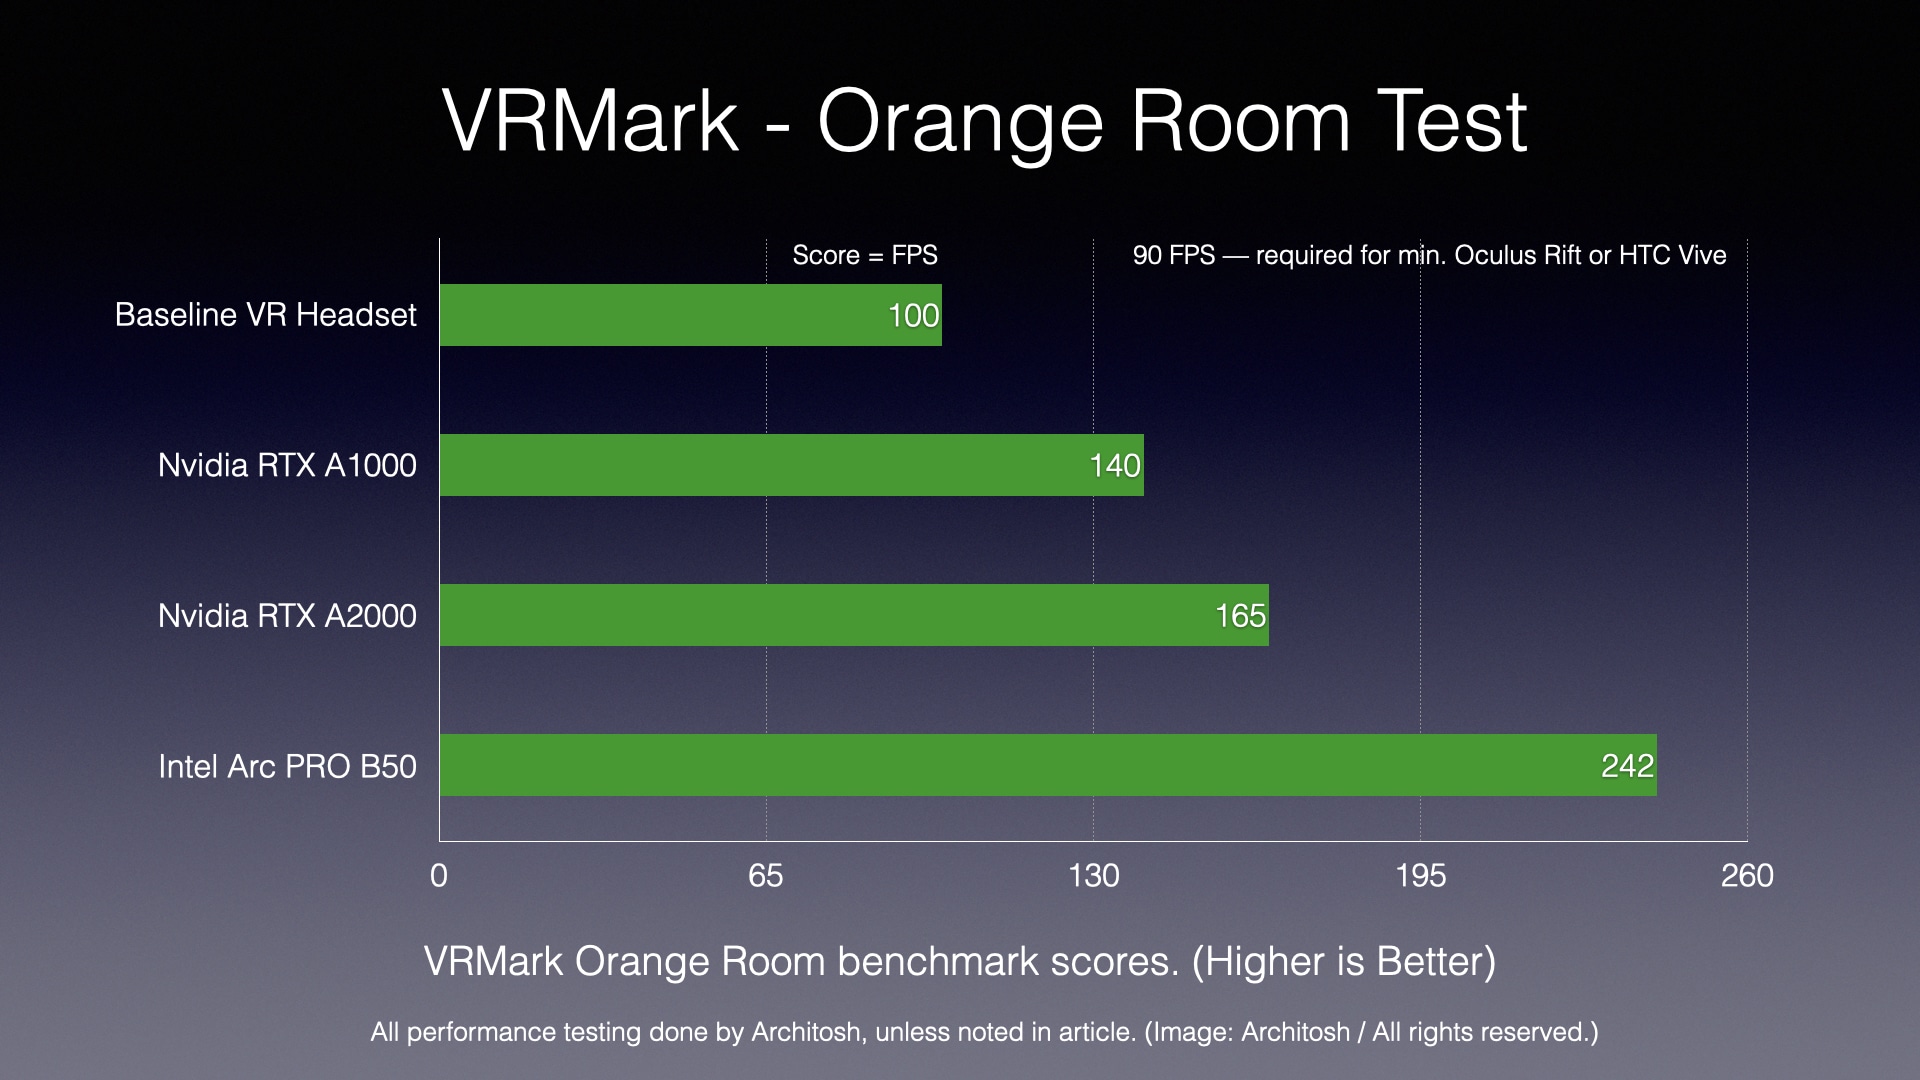
Chart 6: VRMark Orange Room test. (Image: Architosh / All rights reserved).
The Intel Arc PRO B50 delivered a score that was 72% better than the reference RTX A1000 GPU and 46% faster than the RTX A2000 GPU.
SPECviewperf v15 — Creo Composite and Shaded with Edge Subtests
We can see from the Subsurface Scattering test and the VRMark score that the Intel B50 GPU seems to shine on rendering workloads, and this will be consistent with its Enscape subtests in the new SPECviewperf v15 benchmark. Turning to the Creo Composite and subtests below, we now focus on OpenGL workloads so common in the MCAD world and with many 3D tools in AEC like Rhino and SketchUp. These tools are beginning to transition to low-level APIs like Direct3D and Vulkan. Rhino 9 will be primarily based on Direct3D, whereas the current versions, 7 and 8, rely mostly on OpenGL.
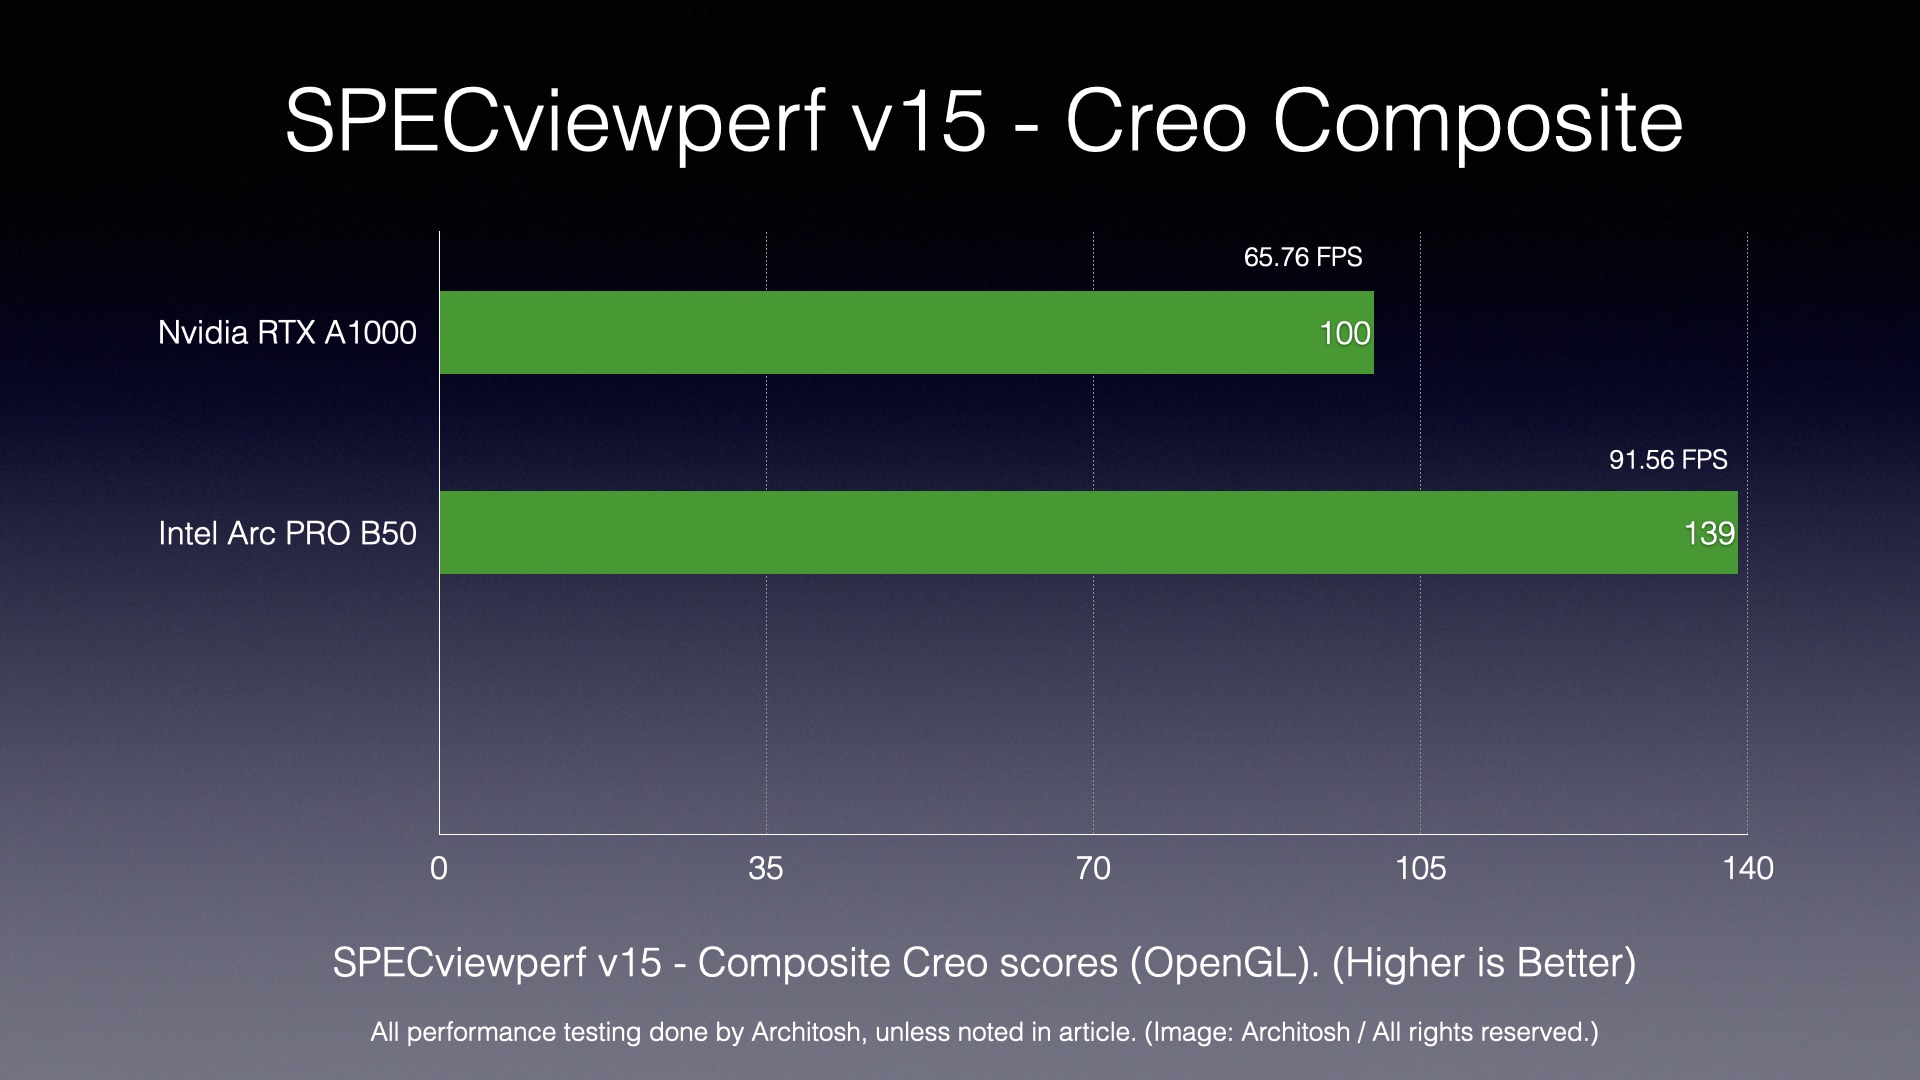
Chart 7: SPECviewperf v15 — Creo Composite test. (Image: Architosh / All rights reserved).
In our Creo Composite test, we can see that the Intel Arc PRO B50 outperformed the reference Nvidia RTX A1000 GPU by 39%. This is a significant beat, but when we dig into the many types of subtests, we see illuminating differences. On tests where AA (anti-aliasing) was turned on, the performance gain over the RTX A1000 was less significant. We saw just a 13% better score over the RTX A1000 on the Creo World Car Shaded with Edges and 4xAA test. However, on the Scorpion without the AA subtest, we observed nearly twice the advantage.
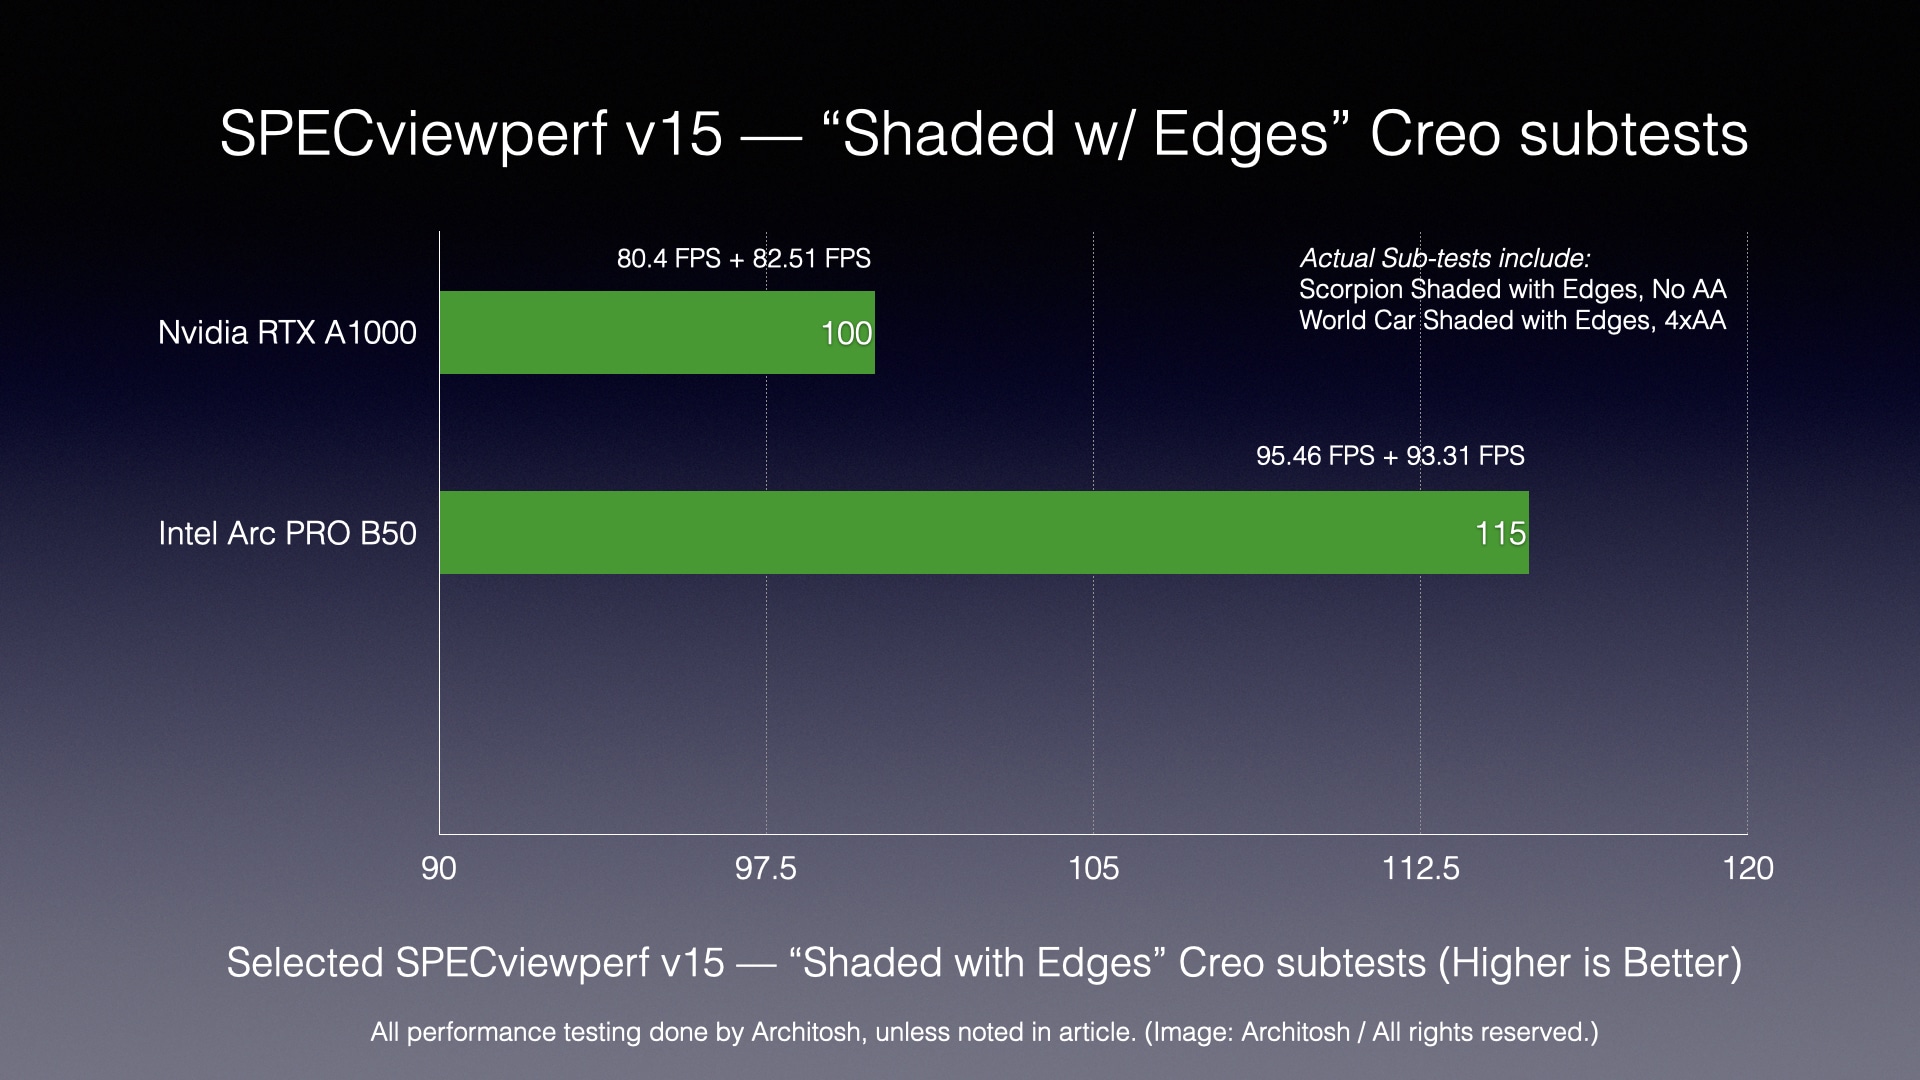
Chart 8: SPECviewperf v15 — Creo Shaded with Edges subtests. (Image: Architosh / All rights reserved).
The Creo “Shaded with Edges” subtests composite score above mixes a blend between two subtests we have focused on in the past, with several reviews (though in the previous version of SPECviewperf). With this blend, we see the Intel B50 performing 15% faster, which is more modest. Still, one must consider GPU economics evaluations, which we do on the next page. This changes the story significantly
SPECviewperf v15 — Enscape Composite
Finally, we were delighted to see an Enscape set of tests added to SPECviewperf v.15. Enscape is the most dominant of the interactive, real-time rendering tools in the AEC industry. It competes head-on with Twinmotion and others, but is the most popular choice.
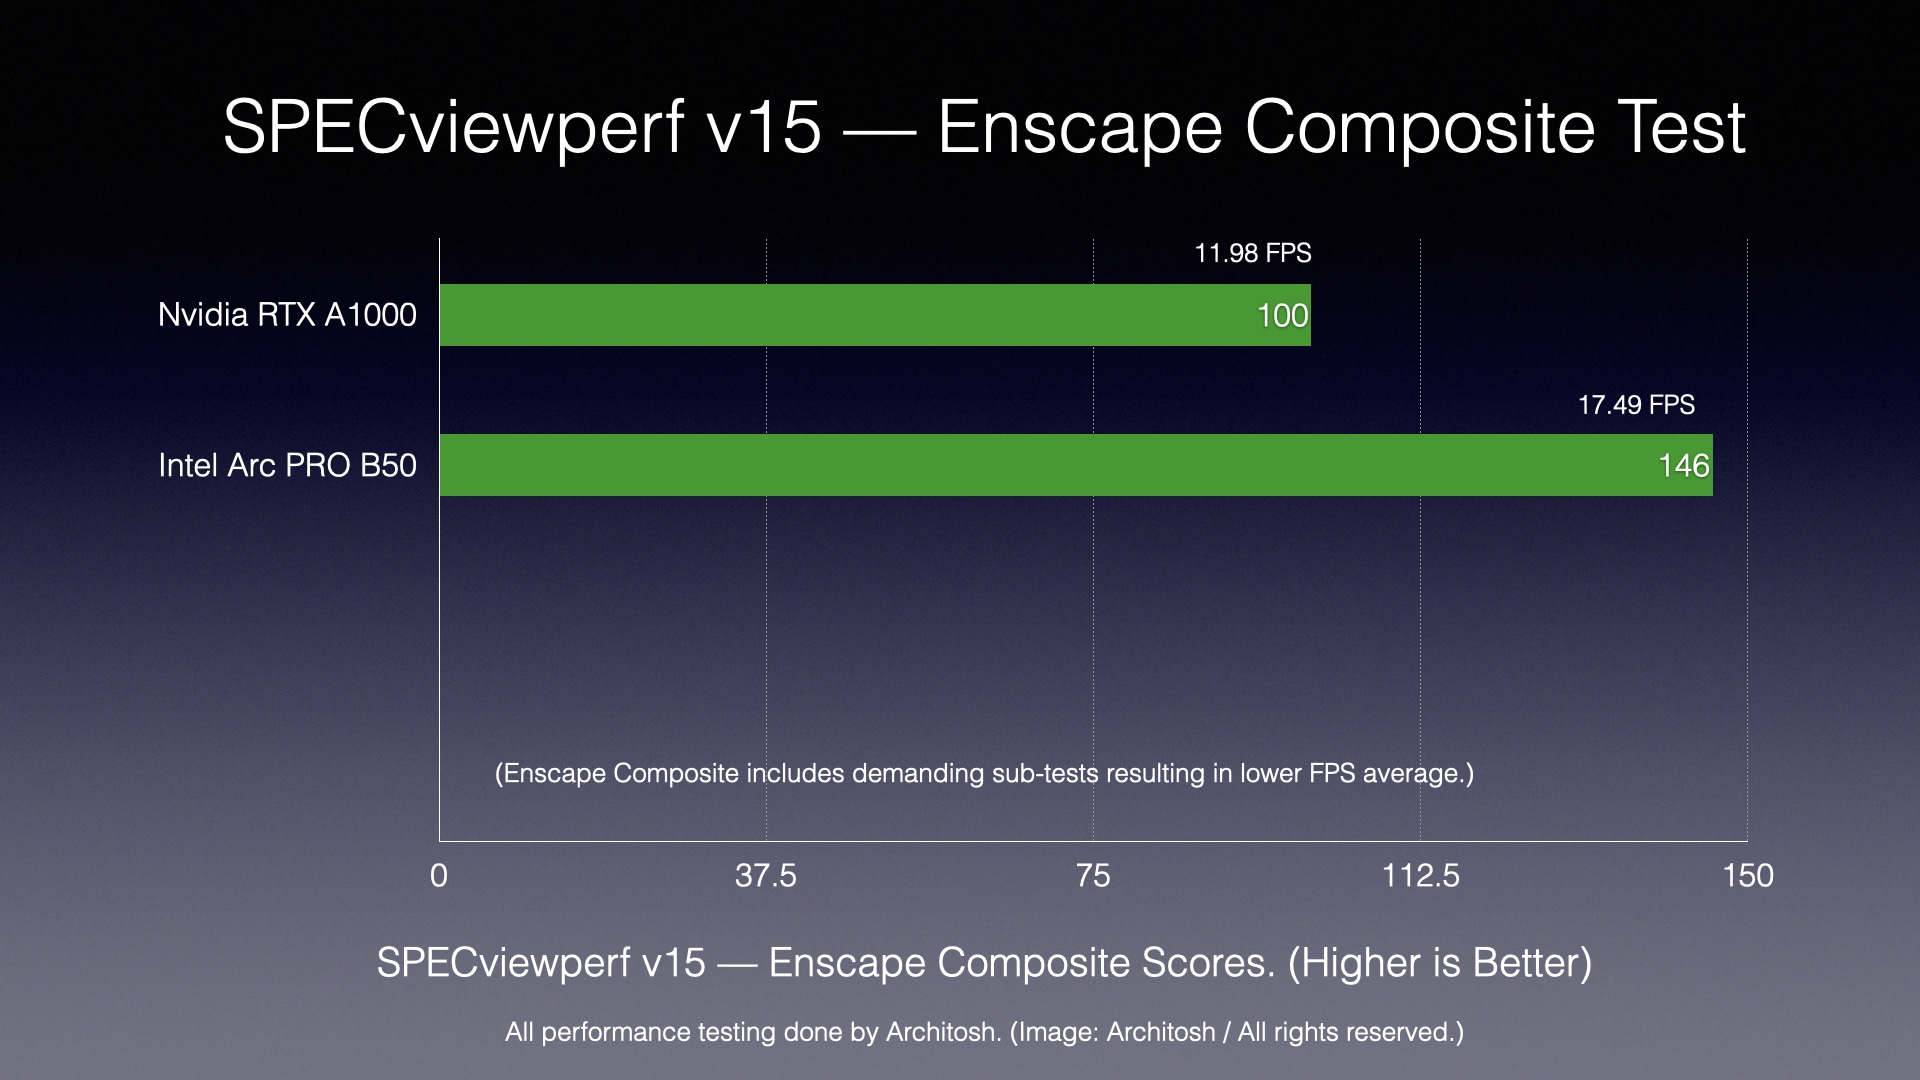
Chart 9: SPECviewperf v15 Enscape Composite test. (Image: Architosh / All rights reserved).
The Intel Arc PRO B50 performed 46% faster than the RTX A1000 GPU. Though we didn’t test it, but could have, as we keep most GPUs sent to us for evaluation, the B50 may have even bested the RTX A2000, though this is speculation. We suspect they would be close.
Performance Results
Across our benchmarks, the Intel Arc PRO B50 outperformed the Nvidia RTX A1000 reference GPU by a wide margin, spanning performance deltas between 15% on OpenGL-based Creo composite tests to up to 100% faster on specific Creo OpenGL shaded with edges model viewports without AA. In general, the Intel GPU was significantly faster on rendering workflows like the SPECviewperf v.15 Enscape tests, where it was 46% faster, which is notable.
What is perhaps most significant is that the Intel Arc PRO B50 is very affordably priced. As we noted in our last Nvidia GPU review, Nvidia’s GPUs have tended to become more expensive as GPU consumption in the era of AI has become massive. That’s where economic metrics come into play (next page).
next page: Economic Metrics & Conclusions
